Data Breach News12 min read
Continuous Security Monitoring: MSP Guide for 2026
By InsecureWeb Team
This report reflects observations of dark web activity. InsecureWeb makes no representations regarding the accuracy of this data.
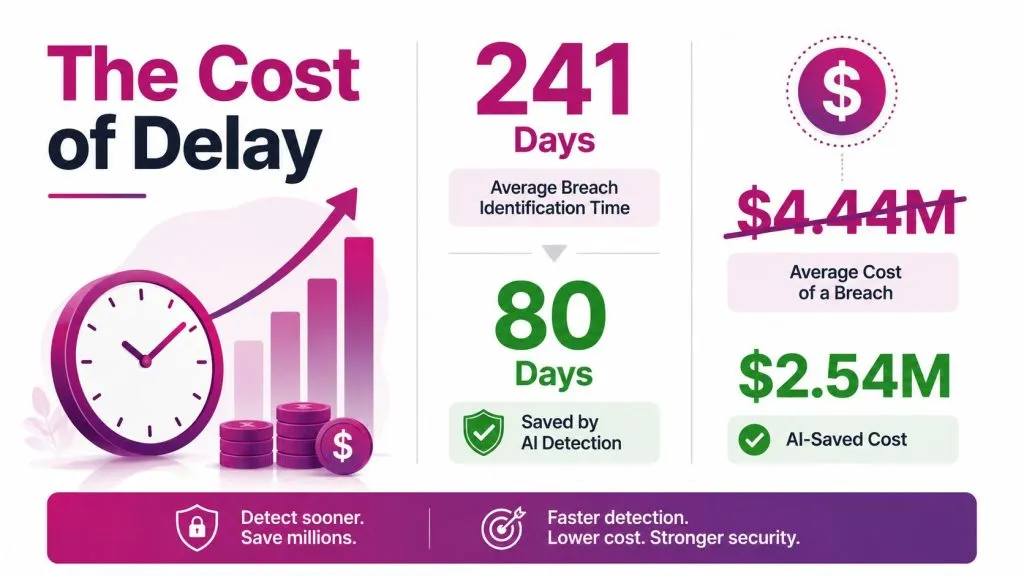
IBM’s breach research shows why continuous security monitoring is not a back-office checkbox. Analysts at IBM have reported that breach identification and containment still take too long in many environments, while AI-assisted detection can shorten the lifecycle and reduce cost. For MSPs and MSSPs, that translates into a simple operational point. If telemetry is slow, fragmented, or missing from key client systems, incident response starts late and every downstream task gets harder.
Continuous security monitoring is a structured control loop of ongoing awareness, assessment, and response, tied to risk thresholds and system risk scores. That shift NIST SP 800-137 established moved security from periodic snapshots to persistent evidence collection and action, which is what modern dashboards and automated workflows still build on today NIST SP 800-137. For MSPs, the test is whether the control loop connects endpoint, identity, cloud, and network telemetry into something operations can use. A monitoring stack that cannot surface abnormal privilege changes, failed authentication patterns, or drift in exposed services is just storage with alerts.
The practical question is not whether a client has tools installed. It is whether those tools produce reliable signals, feed the right response paths, and support measurable service outcomes. That is also where attack surface analysis becomes useful, because it shows which assets and exposures should be watched first. In hybrid and shadow-IT environments, that distinction matters more than a generic definition of monitoring.
What Continuous Security Monitoring Actually Is
MSPs care about continuous security monitoring because breach delays turn into real cost, real downtime, and real client pressure. The point is not to collect more alerts. The point is to shorten the time between a control failure, a suspicious event, and a response that protects the business.
Control loop, not alert feed
A lot of teams still treat CSM like a bigger SIEM alert stream. That misses the operational point. Always-on alerting only tells you that something fired, while a real monitoring program uses telemetry to assess posture, compare it against tolerance thresholds, and trigger action when the signal matters.
That distinction matters in multi-client environments, where one noisy source can bury a meaningful event. Telemetry without decision logic becomes noise, and noise scales badly when an MSP is responsible for multiple client environments.
Practical rule: if a metric can’t drive a decision, it’s trivia. If it can’t drive remediation, it’s not monitoring.
What this guide is really for
For MSPs and MSSPs, the useful question is not whether a tool can ingest logs. The useful question is whether it can help you answer client questions about exposure, remediation, and compliance without forcing your team to manually reconcile every source.
That means focusing on architecture, KPIs, integration paths, and the messy realities of hybrid estates. It also means accepting trade-offs. Some clients want broad visibility across every control plane, while others care more about a smaller set of indicators that map cleanly to service-level reporting and audit evidence. A monitoring program has to work across different clients with different tool stacks, risk tolerances, and reporting expectations.
Core Components of a Continuous Monitoring Program
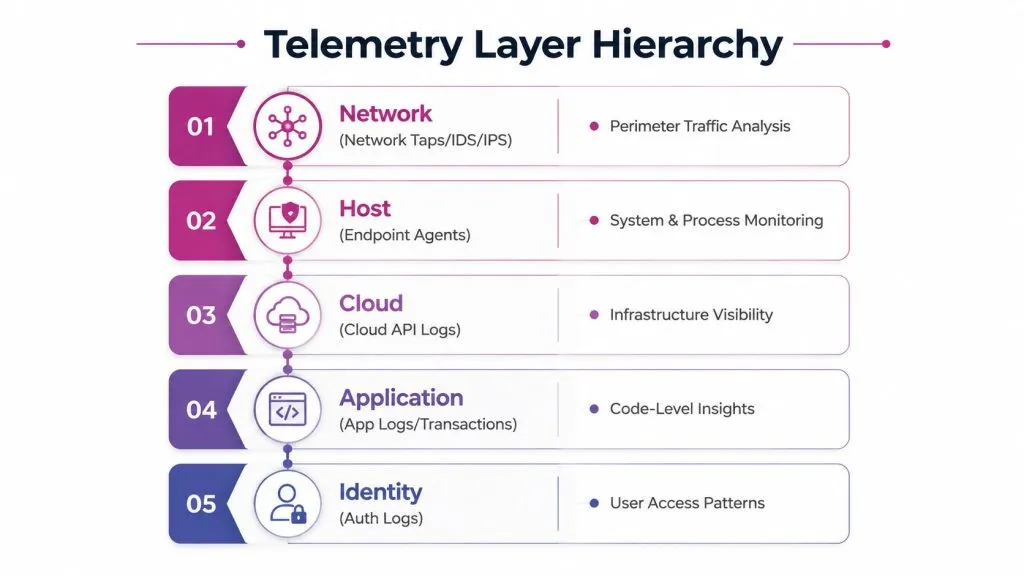
A credible program starts with telemetry that covers different control layers, because no single feed gives you enough context. NIST’s continuous monitoring annex points to network taps, IDS/IPS, host-based monitoring, vulnerability scanners, system event logs, WIDS/WIPS, device health attestation, and integrity verification as part of maintaining a current picture of risk and control effectiveness NSA Continuous Monitoring Annex%20Continuous%20Monitoring%20Annex%20v2_0_0%20DRAFT%201.pdf?ver=YNlpbN5bXEFWKUlUo6izEA==).
Five telemetry layers that actually matter
Network taps and IDS/IPS give you perimeter traffic analysis. They help you see lateral movement patterns, suspicious connections, and traffic that never should have left a segment in the first place.
Host-based security monitoring and endpoint detection platforms show what the network can’t, including process activity, local persistence, and device-level anomalies. Vulnerability scanners map exposure to known and emerging weaknesses, which is where prioritization starts, not ends.
System event logs and integrity verification expose unauthorized change, drift, and tampering. WIDS/WIPS adds wireless visibility, while device health attestation tells you whether the endpoint is in a trustworthy state before you rely on its telemetry.
Why correlation beats isolation
Each layer is weak in isolation. A failed login on its own may be nothing, but the same event combined with unusual host activity and a fresh vulnerability finding becomes much harder to dismiss. That’s the core reason MSSPs should integrate these feeds instead of selling them as standalone tools.
If you want a practical way to think about the asset side of this, attack surface work helps define what should be in scope first, which is why some teams pair monitoring with attack surface analysis to avoid collecting data from the wrong places.
| Layer | What it contributes | Why it matters |
|---|---|---|
| Network telemetry | Traffic and boundary context | Helps spot suspicious movement |
| Host telemetry | Device and process behavior | Reveals activity hidden from perimeter tools |
| Vulnerability data | Exposure and patch gaps | Guides priority, not just awareness |
| Logs and integrity checks | Drift and unauthorized change | Supports incident and compliance evidence |
| Wireless and attestation | Device trust and connection context | Reduces blind spots in mixed environments |
The practical value of this stack is not volume. It’s the ability to answer, quickly and defensibly, whether a control is working and where the biggest risk sits.
How Continuous Security Monitoring Architecture Works in Practice
The architecture matters because it determines whether telemetry becomes a decision or just another pile of alerts. In MSP and MSSP environments, the difference usually comes down to how well the platform correlates weak signals across identities, endpoints, networks, and cloud services. Without that layer, analysts end up clicking through isolated events instead of seeing a coherent incident path.
From collection to response
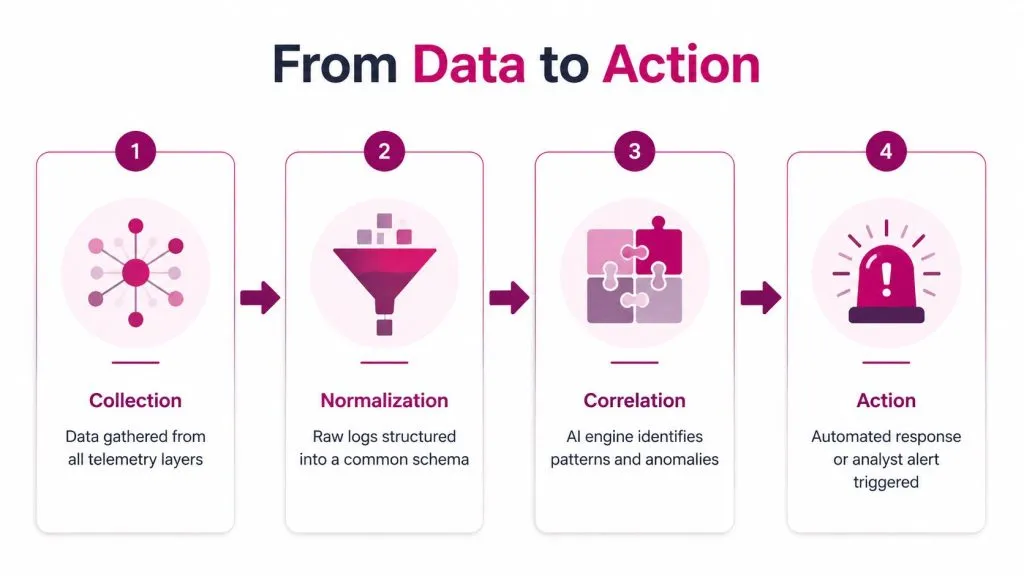
The first step is collection at the edge, where endpoint agents, network devices, cloud logs, and other feeds send data into a central pipeline. The second step is normalization, which matters because telemetry that arrives in different formats cannot be compared cleanly or trusted at scale.
Then comes event correlation, where the platform looks for relationships across assets, identities, timing, and change history. That is the point where a log entry becomes a risk decision. The final step is action, which may be automated containment, a ticket, a notification, or a request for human review, depending on client policy and the tolerance for interruption.
The best monitoring platforms do not just collect more. They reduce uncertainty before they raise the alarm.
Why one view matters in hybrid environments
MSPs rarely get neat environments. One client may be mostly on-premises, another cloud-heavy, and a third built around a legacy core with modern SaaS layered on top. The architecture has to unify those worlds or the team ends up triaging fragments instead of incidents.
That unified view also matters for compliance work. NIST SP 800-137 frames continuous monitoring around measurable inputs such as vulnerability counts and severity, unauthorized access attempts, configuration baseline information, contingency plan testing dates, and employee awareness-training status NIST SP 800-137. Those inputs are still useful because they connect operational evidence to control effectiveness in a way auditors can follow.
The goal is a current risk view, not a folder full of screenshots. If the architecture cannot show what changed, what that change means, and what happened next, it is not ready for managed services at scale.
KPIs and Compliance Metrics That Matter for MSPs
MSPs need a short list of metrics clients can understand and auditors can defend. Anything else turns into reporting theater. The point is to show whether the monitoring program is shortening exposure, cutting noise, and improving remediation discipline.
The four KPIs worth surfacing
Mean time to detect measures how fast the program identifies a threat. It tells a client how quickly a problem becomes visible, which is the first limit on breach exposure.
Mean time to respond tracks how quickly remediation starts after detection. That matters because response delay extends the window in which an attacker can keep working.
False-positive rate shows signal quality. High false positives burn analyst time, weaken client trust, and make it harder to get buy-in for real escalation.
Alert-to-remediation ratio shows how much of the alert stream turns into actual corrective action. It is a simple way to show whether the pipeline produces outcomes or just activity.
How to make the metrics useful to clients
These KPIs should appear in recurring client reports, not just internal dashboards. Auditors and regulators usually care less about the raw number itself than the consistency of the process, the evidence behind it, and the traceability from finding to remediation.
The business case is straightforward, because shorter lifecycle and lower dwell time reduce loss exposure. Analysts at IBM have made that connection clear in IBM breach analysis summary, which is useful when you need to justify monitoring spend against other operational priorities.
For MSPs working in regulated markets, the reporting side matters just as much as the detection side. If you are trying to shape client conversations in the UK, browse UK compliance opportunities with that reporting lens in mind, because compliance discussions usually start with evidence quality, not tool features.
| KPI | What it tells the client | Why it matters operationally |
|---|---|---|
| MTTD | How quickly threats become visible | Shrinks the exposure window |
| MTTR | How quickly response begins | Speeds containment and recovery |
| False-positive rate | How much noise the team must handle | Protects analyst attention |
| Alert-to-remediation ratio | Whether alerts turn into fixes | Shows whether the pipeline works |
The strongest reports are short, repeatable, and tied to action. If a client cannot tell what improved since the last cycle, the reporting is not doing enough work. For follow-up handling after a confirmed incident, a practical incident response workflow helps keep remediation evidence aligned with the metrics you already report.
A Practical Implementation Roadmap for MSPs and MSSPs
Most monitoring programs fail because teams try to automate before they know what they’re covering. Asset visibility has to come first. You can’t monitor what you can’t identify, and you definitely can’t prioritize what you haven’t scoped.
Phase one through four
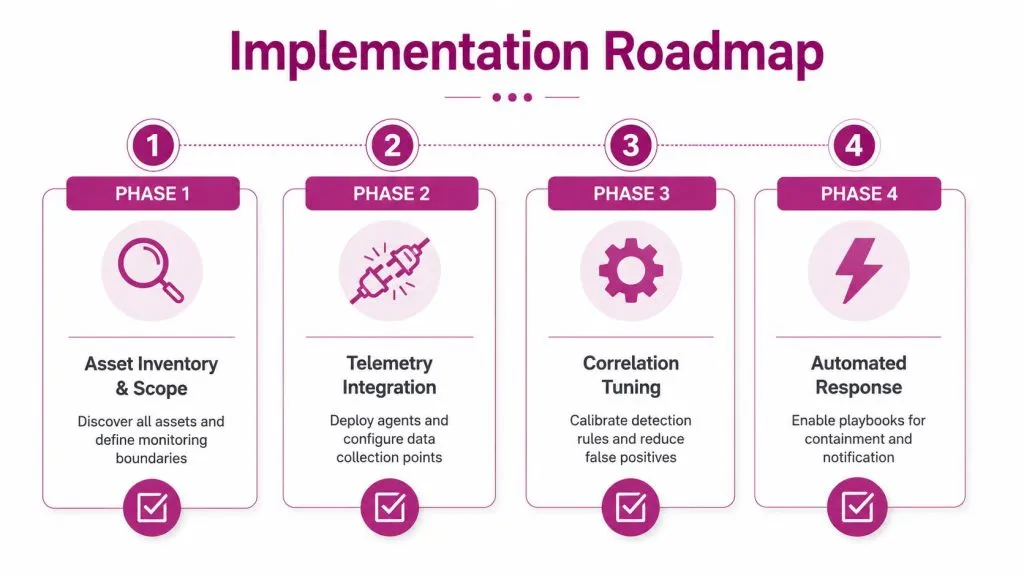
Phase one is asset inventory and scope definition. Start with every managed domain, workload, endpoint class, and business-critical data store. Define what counts as in scope before you wire in tools, or the program will drift as clients add services.
Phase two is telemetry integration. Connect the data sources that matter most to the client’s risk profile, then normalize them into a structure your team can use. InsecureWeb offers free API access, which makes it possible to connect alerting and exposure data into the SIEM, ticketing, or vulnerability management tools MSPs already use.
Phase three is correlation tuning. This step helps teams earn back time. Refine rules, remove duplicate paths, and calibrate what should escalate versus what should stay as context.
Phase four is automated response. Use playbooks for containment, notification, and ticket creation, but keep guardrails in place. Not every event should trigger full automation, especially in customer environments where change control matters.
Start with the assets that can hurt the client fastest, then expand inward as coverage stabilizes.
A defensible prioritization order
Hybrid and shadow-IT-heavy environments usually can’t be fully instrumented on day one. That’s normal. The practical order is internet-facing assets first, then critical data stores, then identity and privileged access paths, and only then the less exposed internal systems.
That sequence works because it aligns coverage with consequence. It also keeps small teams from wasting effort on low-value sources while critical blind spots stay open. If you’re trying to get from “we collect logs” to “we can prove coverage,” this is the least painful path I’ve seen work consistently.
The point isn’t perfection. The point is a sequence your team can execute without turning every onboarding into a six-month project.

Common Challenges and How to Mitigate Them
The hardest problems in continuous security monitoring usually aren’t technical. They’re about coverage, trust, and the amount of noise a team can tolerate before it stops paying attention.
Seven blind spots that break coverage
A 2022 IEEE article called out seven blind spots that make continuous coverage hard in practice, encryption, cloud, data volume, shadow IT, scattered identities, multihomed devices, and nonenterprise IT IEEE article on CSM blind spots. That list matters because generic advice like “identify assets” or “monitor third parties” doesn’t tell you how to handle unmanaged identities, devices that live on multiple networks, or encrypted traffic that hides useful context.
Coverage gaps often show up first in hybrid estates. A client thinks the environment is covered because the SIEM is full, but the high-risk assets sit outside the clean instrumentation path. That’s why coverage order matters more than collection volume.
What actually helps
Correlate before you escalate. If every anomaly becomes a ticket, analysts start ignoring the queue. Tightening correlation rules usually does more for response quality than adding another source.
Use a defensible scope. Start with the assets that matter most and make the exclusions explicit. That’s better than pretending full coverage exists when it doesn’t.
Reduce tool sprawl. Too many overlapping dashboards split the analyst’s attention and make it hard to explain outcomes to clients. One operational view, with the right integrations behind it, is easier to sustain than a stack of disconnected point products.
For response planning, the next practical step after a confirmed incident is disciplined containment and review, which is why some teams keep a runbook linked to steps after a data breach so the response path doesn’t depend on memory.
If the team can’t explain why an alert matters in one sentence, the rule probably needs another pass.
The best mitigation strategy is boring by design. Narrow the scope, improve the signal, and keep the workflow consistent across clients so the program doesn’t collapse under its own volume.
Real-World Use Cases and Success Criteria
A mid-size MSP with twelve clients usually sees the same operational problem in different forms. One client wants dark web exposure checks for stolen credentials, another needs shadow IT discovery, and a third needs a monthly compliance report that can stand up to audit questions. Continuous security monitoring ties those requirements together without forcing the team to manage each one as a separate service.
What this looks like in practice
The MSP starts by ingesting telemetry from network, endpoint, vulnerability, and identity layers, then enriches it with exposure data tied to client assets. That gives the team enough context to tell whether a credential leak, an unmanaged application, or a configuration drift event matters to the client’s environment.
Dark web exposure monitoring is useful here because it helps catch leaked credentials before they are reused. For MSPs that need a structured way to deliver that service, dark web monitoring for managed service providers fits naturally into a broader monitoring stack.
Monthly reporting becomes easier once the KPIs stay consistent. The MSP can show detection speed, response speed, noise levels, and whether findings moved to remediation. That gives the client a usable account of risk, not just a pile of alerts.
What success should look like
Reduced mean time to detect shows the program is seeing problems faster. Lower false-positive rates show analysts are spending time on real work. Demonstrable compliance coverage shows the client can defend the control set. Measurable reduction in risk exposure shows the monitoring program is affecting outcomes, not just producing reports.
The financial side is harder to ignore when clients see how breach delays affect recovery cost. The practical point is simple. Every day removed from the breach lifecycle matters, and that is a language clients understand quickly.
For teams building out reporting, the useful questions are whether the service can prove coverage, show trend lines, and tie alerts to action. A clean report that connects telemetry, investigation, and remediation carries more weight than a dashboard full of raw events. That is also where dark web monitoring for managed service providers can add client-facing value, since exposed credentials are easy to explain and easy to track over time.
The clean takeaway is simple. MSPs that package monitoring as an evidence-driven service, not a noisy tool set, have a stronger story under their own brand.