Data Breach News15 min read
Cloud Native Endpoint Protection: Secure Dynamic Workloads
By InsecureWeb Team
This report reflects observations of dark web activity. InsecureWeb makes no representations regarding the accuracy of this data.
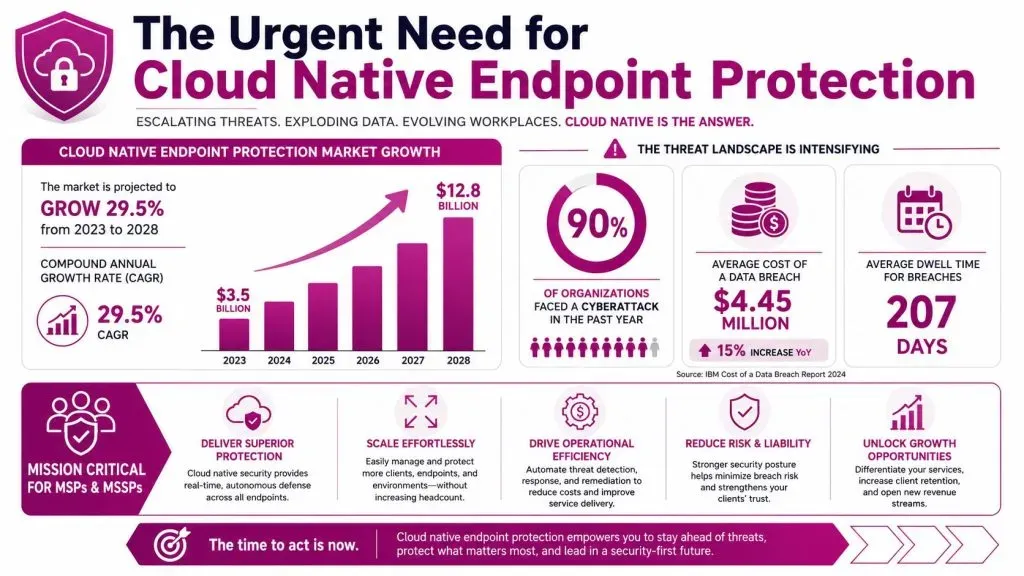
The cloud endpoint protection market is on a steep climb. One market analysis values it at USD 2.59 billion in 2026, up from USD 2.27 billion in 2025, and projects USD 4.99 billion by 2031 at a 14.04% CAGR according to Mordor Intelligence’s cloud endpoint protection market analysis. That growth matters because the old model of endpoint defense was built for stable laptops, long-lived servers, and well-defined network edges. Cloud workloads don’t behave that way.
MSPs and MSSPs now protect containers that may exist for minutes, serverless functions that never accept a traditional agent, and identities that can do more damage than malware. If you still think endpoint protection starts with installing software on every host, you’re already missing part of the problem. Security has moved into the control plane, the runtime, the API layer, and the identity stack.
That shift also changes service design. Teams that already invest in prevention earlier in the lifecycle often pair workload protection with practices from this guide to shift left security, because build-time controls and runtime visibility work better together than either one alone.
Introduction to Cloud Native Endpoint Protection
Cloud native endpoint protection secures workloads that are dynamic, distributed, and heavily driven by APIs. That includes virtual machines, containers, Kubernetes nodes, serverless functions, build runners, and the identities that operate them. The phrase sounds like a simple extension of EDR, but it isn’t. It reflects a change in where attacks happen and how defenders collect evidence.
A traditional endpoint tool usually expects a durable operating system and a host-level agent. Cloud native environments break those assumptions. A container may be replaced before an analyst reviews an alert. A serverless function may never support the same controls you’d use on a VM. A compromised identity can create, alter, or destroy workloads without dropping a suspicious file on disk.
Practical rule: If your detection strategy only sees host activity, it won’t reliably see cloud native abuse.
For MSPs, this creates both pressure and opportunity. Clients need coverage across mixed estates that include older servers and modern cloud platforms. They also need a provider that can explain why runtime protection, identity monitoring, and cloud telemetry belong in the same service.
The most useful way to think about cloud native endpoint protection is this:
| Traditional endpoint view | Cloud native endpoint view |
|---|---|
| Protect the device | Protect the workload and its permissions |
| Inspect files and processes | Inspect runtime behavior, API activity, and identity use |
| Assume stable hosts | Assume short-lived and replaceable workloads |
| Focus on malware execution | Focus on abuse of cloud features and access paths |
MSPs that understand that shift can design services that fit where clients are headed, not where their infrastructure used to be.
Defining Concepts of Cloud Native Endpoint Protection
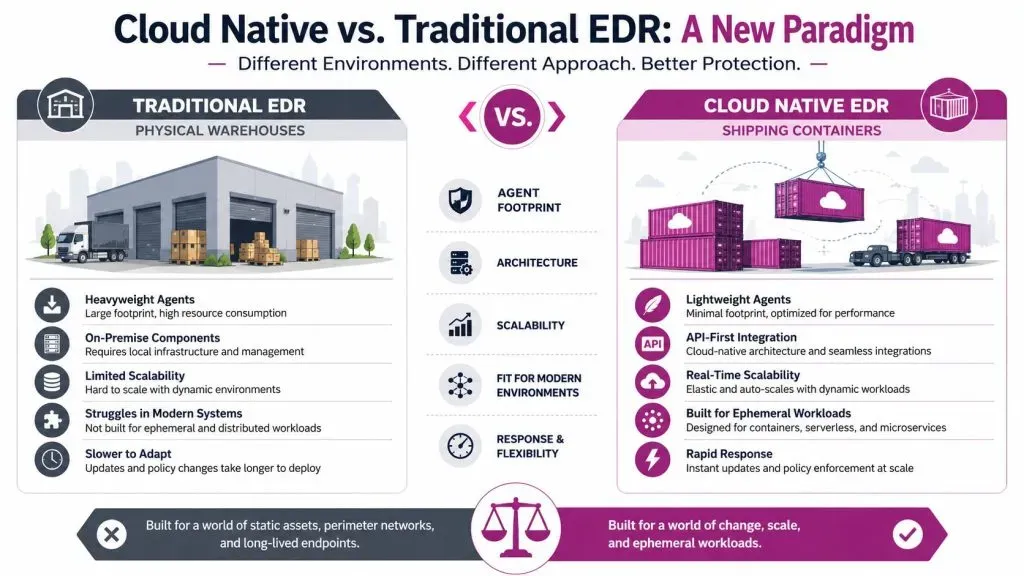
The easiest way to understand cloud native endpoint protection is to compare it to shipping logistics. Traditional EDR is like securing a warehouse. You know where the doors are, the building stays put, and guards can patrol the same floor plan every day. Cloud native security is closer to securing shipping containers moving through ports, rail yards, and trucks. The assets appear, move, split apart, and disappear on tight schedules.
Why traditional endpoint logic breaks
A legacy endpoint product usually starts with an installed agent, a known host, and signatures or behavior models tuned for desktops and long-lived servers. That model still matters for many workloads, especially VMs. But cloud platforms introduce components that may be too short-lived, too abstracted, or too operationally constrained for classic host tooling.
A Kubernetes pod, for example, may be recreated automatically after a deployment or crash. If your tool needs time to install, learn, and report, the workload may vanish before protection becomes meaningful. That’s why many teams complement host telemetry with API-level visibility and runtime signals.
A good primer on mapping these exposures is attack surface analysis for modern environments. It helps security teams move beyond the idea that the endpoint is only a laptop or server.
Later in the section, it helps to see the ideas discussed in another format:

What counts as an endpoint now
In cloud native environments, an endpoint can mean several things at once:
- A virtual machine: Still important, especially for stateful apps and legacy systems migrated to cloud infrastructure.
- A containerized workload: Short-lived application units that share host resources and need runtime-aware controls.
- A serverless execution context: Event-driven code where the provider abstracts most of the host layer away.
- A cloud identity: Service accounts, roles, and federated users that can invoke APIs, create workloads, or alter permissions.
- A control-plane action: Changes made through the cloud provider interface, orchestration system, or infrastructure-as-code pipeline.
Cloud native endpoint protection isn’t just agent software with a new label. It’s a way of combining host, runtime, identity, and cloud control signals into one defensive model.
That vocabulary matters because many buying teams still ask for “endpoint protection” when they require workload security plus control-plane detection plus policy enforcement.
Threats Unique to Cloud Native Workloads
The cloud native threat model looks ordinary on the surface. A workload gets exposed, an account is abused, data moves where it shouldn’t. The difference is in the mechanics. The attacker often doesn’t need malware persistence on a host. They can work through bad permissions, exposed APIs, weak workload boundaries, or overlooked resources.
Misconfigurations beat malware headlines
According to SentinelOne’s cloud security statistics overview, 95% of cloud security failures stem from misconfigurations due to human error, while compromised identities account for over 70% of cloud breaches. That’s why cloud native defense starts with discipline around configuration, access, and telemetry, not only malware scanning.
A simple example is an exposed storage resource or an over-permissive service role tied to an application deployment. Nothing about that event looks like a traditional endpoint incident at first. Yet it can lead to data access, lateral movement, and environment takeover.
If your team wants a broader primer on recurring exposure patterns, Networking2000’s cloud security guide is a useful companion read.
Common cloud native mistakes include:
- Loose permissions: Service roles get broad rights because teams optimize for speed during deployment.
- Forgotten assets: Temporary workloads, test projects, and abandoned integrations stay reachable longer than expected.
- Weak secret handling: Credentials end up in build logs, environment variables, or images.
- Registry exposure: Container artifacts become accessible beyond the intended team or account boundary.
Identity and control plane attacks
Cloud native attackers often follow the path of least resistance. That path may be an access token, a role assumption, or a deployment action rather than a suspicious binary. If a threat actor can authenticate, they may blend into normal operations unless defenders correlate identity events with runtime behavior.
One useful supporting practice is external exposure monitoring. Security teams that track leaked credentials and related risk signals often pair cloud investigation with services like a dark web scan for exposed account data, because identity misuse frequently starts outside the runtime itself.
When defenders treat identity logs as separate from endpoint telemetry, they create a blind spot attackers know how to use.
Cloud native workloads also create timing problems. A suspicious pod might live briefly, contact an unexpected destination, and disappear during an automated rollout. Signature-based tools often struggle when the key evidence sits in orchestration logs, access events, and runtime traces rather than a static file on disk.
Architectural Patterns and Components
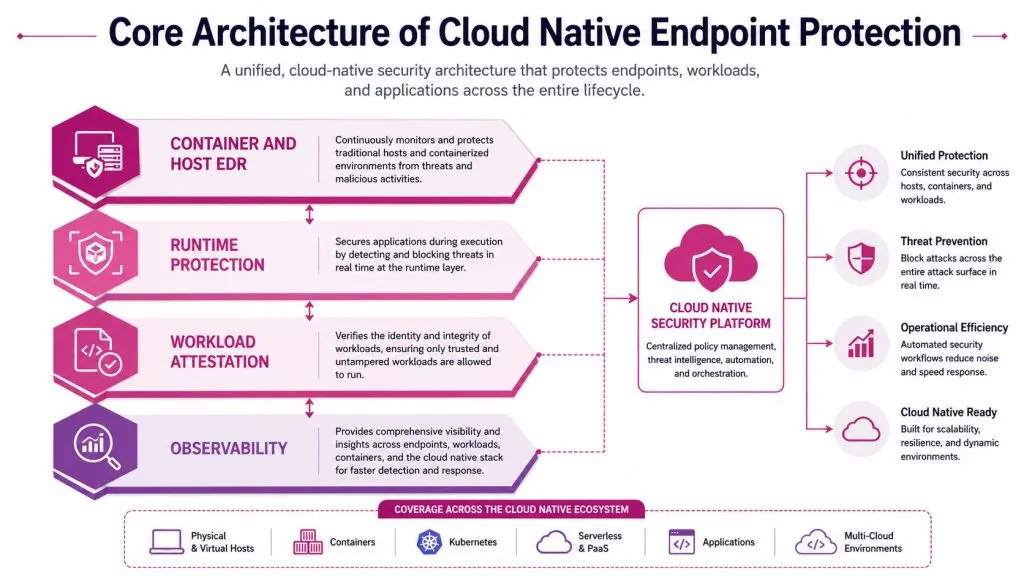
Cloud native endpoint protection works best as a layered system, not a single product category. Teams often buy one platform and expect coverage to appear automatically. In practice, strong coverage comes from combining several components that answer different questions. What is this workload? What is it doing right now? Who started it? What changed around it?
The four layers that work together
Start with container and host protection. Some workloads still need classic host controls, especially cloud VMs running long-lived services. Others need container-aware visibility that can inspect processes, namespaces, file changes, and network behavior at runtime. A modern design doesn’t force one model onto every asset. It maps controls to workload type.
Then add runtime protection. The Cloud Native Computing Foundation notes that cloud-native endpoint protection mandates runtime monitoring of container processes, files, and networks with strict seccomp enforcement to prevent unauthorized host OS calls and privilege escalation. This is one of the clearest dividing lines between old and new approaches. In cloud native systems, what a workload is allowed to call and modify during execution matters as much as what software package it came from.
Next comes workload attestation and integrity validation. Before trusting a workload, teams should know where the image came from, whether it was approved, and whether its execution context matches policy. This helps separate sanctioned deployments from drift, tampering, or shadow infrastructure.
Finally, you need observability and event correlation. Runtime events alone don’t tell the full story. You also need cloud audit trails, identity activity, orchestration changes, and network context flowing into the same investigative path.
A simplified view looks like this:
| Layer | Main purpose | Typical signals |
|---|---|---|
| Host and container coverage | Watch execution on compute assets | Process activity, file changes, network connections |
| Runtime enforcement | Block dangerous behavior during execution | Syscalls, privileged actions, mount changes |
| Workload integrity | Verify what should be running | Image provenance, deployment metadata, policy match |
| Observability and correlation | Tie events into incidents | Cloud logs, identity events, orchestrator actions |
How the layers stop real attacks
Consider a container that suddenly spawns a shell, modifies a sensitive binary path, and attempts an outbound connection to an attacker-controlled destination. Host telemetry might catch the process. Runtime enforcement can restrict the system calls that make the escalation possible. File monitoring can flag or prevent changes that support persistence. Egress monitoring can identify suspicious outbound control traffic.
That combination matters because each control covers a different part of the kill chain. One signal alone may be ambiguous. Several signals together are investigative gold.
The best cloud native architectures don’t ask one tool to do everything. They let each layer answer a narrow question, then correlate the answers.
There’s also a people component. Many MSPs need engineers who understand infrastructure-as-code, identity design, Kubernetes, and cloud logging, not just endpoint policy tuning. Firms that need to expand capability often look to specialized talent sources such as teams that hire cloud infrastructure security engineers, because the architecture only works when someone can operate it competently.
Operating model for MSP teams
The operational pattern usually follows three tracks:
- Platform onboarding
Connect cloud accounts, collect audit logs, map identities, and validate workload coverage. This creates the telemetry foundation. - Policy alignment
Define what sanctioned runtime behavior looks like. That includes approved images, expected network paths, and restricted privilege use. - Incident handling
Route findings into a SOC process that can investigate both workload behavior and cloud administrative actions in the same case.
MSPs that skip the second step often create alert-heavy services that clients don’t trust. The goal isn’t maximum visibility by itself. The goal is high-confidence visibility that supports action.
Implementation Guidance and Operational Playbooks
For many providers, the hardest shift isn’t technical. It’s mental. They know how to deploy endpoint agents, tune malware detections, and escalate suspicious host events. What they don’t always have is a repeatable method for catching abuse that happens through identities, APIs, orchestration actions, and ephemeral runtime behavior.
That gap matters because 78% of cloud-native attacks bypass host-based detection by targeting identity and control-plane signals, according to the analysis on why cloud-native attacks bypass traditional endpoint detection. If your service only monetizes host telemetry, your coverage model doesn’t match the attack path.
What agentless detection actually means
Agentless doesn’t mean visibility without engineering. It means collecting and correlating security evidence without depending on a host-installed sensor for every workload. In practice, that usually includes cloud audit logs, identity provider events, Kubernetes audit records, image and registry metadata, and selected runtime signals from the platform layer.
A practical agentless workflow often looks like this:
- Collect cloud control-plane events: Track resource creation, security group changes, role updates, and suspicious administrative actions.
- Ingest identity activity: Watch sign-ins, token use, privilege changes, and service account behavior.
- Pull runtime context where available: Use platform integrations to understand which workloads ran, what they accessed, and whether they drifted from policy.
- Correlate in SIEM or XDR: Join the events into timelines that show cause and effect instead of isolated alerts.
This is especially useful in environments where traditional deployment methods don’t fit. Short-lived build workers, managed Kubernetes services, and serverless components often need control-plane-first monitoring.
A practical service playbook
Here is a sample operational playbook MSPs can adapt for a new client.
Phase one: onboarding
- Map the estate: List cloud accounts, clusters, registries, identity providers, and existing SIEM or XDR tools.
- Choose log priorities: Start with audit trails, authentication events, and orchestration logs before adding lower-value feeds.
- Define critical identities: Flag admin roles, automation accounts, deployment identities, and third-party integrations.
Phase two: policy baselining
- Document normal changes: Which teams deploy workloads, at what times, through which pipelines.
- Set drift conditions: Identify what counts as a suspicious permission change, new public exposure, or unapproved image source.
- Establish escalation paths: Decide whether CloudOps, DevOps, or SecOps owns each alert type.
Phase three: detection engineering
- Write correlation rules: Connect identity changes with new workload creation, odd network egress, or policy exceptions.
- Tune for environment context: A cluster used for CI will look different from a production customer platform.
- Automate enrichment: Add tags, ownership data, environment labels, and recent deployment context to every alert.
Phase four: response
- Contain through cloud controls: Disable tokens, revoke sessions, quarantine workloads, or block risky egress paths.
- Preserve evidence: Snapshot relevant logs, deployment metadata, and policy states before the workload disappears.
- Review root cause: Determine whether the issue started with identity misuse, deployment error, or exposed service configuration.
One way to strengthen triage is to enrich incidents with external compromise context. For example, when account or customer exposure is suspected, analysts may consult reporting such as this DigitalOcean breach overview involving client emails found on the dark web. It reminds teams that cloud incidents often spill into identity and exposure management, not just infrastructure response.
Treat cloud audit logs like endpoint telemetry. They are not “administrative records.” They are security evidence.
How MSPs can package and monetize it
Most guides stop at implementation. MSPs need a commercial model too. The cleanest packaging approach is to sell cloud native endpoint protection as a set of layered services rather than a single SKU.
A practical catalog might include:
| Service layer | What the client buys | Why it sells |
|---|---|---|
| Monitoring foundation | Account onboarding, log ingestion, baseline alerting | Fast entry point for clients new to cloud security |
| Runtime and policy service | Workload policy tuning, runtime detections, drift review | Higher-value managed expertise |
| Incident response add-on | Investigation, containment, and post-incident reporting | Ties security outcomes to business continuity |
| Fractional cloud security advisory | Architecture reviews and control alignment | Strong fit for growing teams without in-house depth |
The monetization logic is simple. Agentless detection creates a recurring service around visibility, tuning, and investigation. Clients don’t just buy a tool. They buy interpretation, response discipline, and policy management across environments their internal teams may not fully understand.
Detection Response Metrics and Practical Checklist
A cloud native service becomes credible when you can measure whether it works. That doesn’t mean flooding clients with vanity dashboards. It means tracking a small set of operational metrics that connect directly to exposure, detection quality, and rollout discipline.
The hybrid challenge is real. 92% of organizations struggle with consistent policy enforcement across hybrid environments, according to Red Hat’s cloud-native security report reference provided here. That’s why metrics should emphasize consistency and control drift, not just raw alert volume.
What to measure
A useful scorecard usually includes both response metrics and engineering metrics.
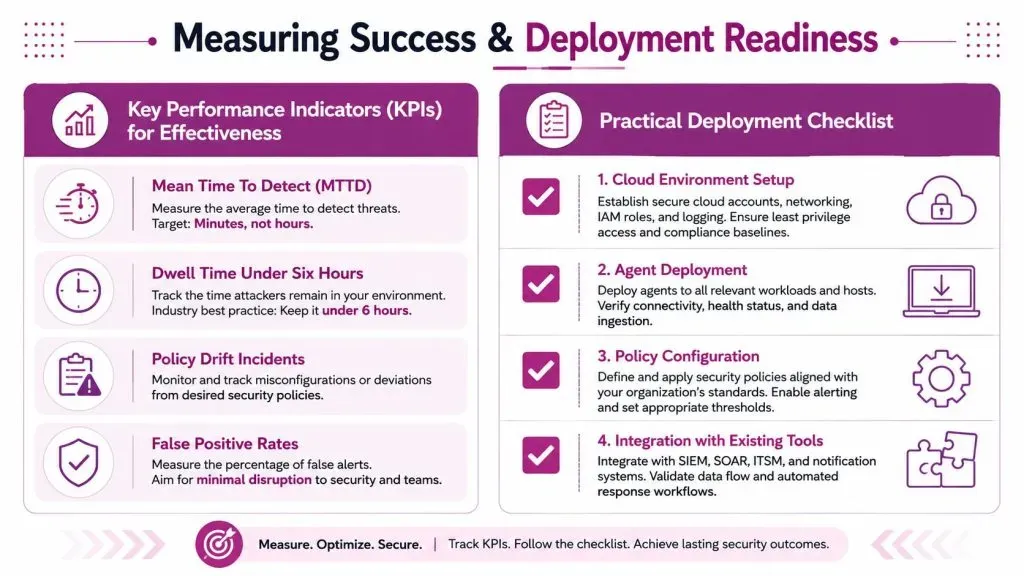
- Mean time to detect: How quickly the team recognizes suspicious activity after the first relevant event lands.
- Containment time: How long it takes to revoke access, isolate a workload, or block risky behavior.
- Policy drift incidents: How often deployed resources move away from approved configuration or privilege rules.
- False positive rate: Whether detections create noise that slows analysts and frustrates clients.
- Telemetry completeness: Whether required cloud, identity, and runtime sources are connected and delivering data.
Some teams also set an internal target to reduce dwell time sharply. The exact target will vary by client maturity, but the principle is universal. The shorter the gap between suspicious action and investigation, the less room an attacker has to expand.
Good metrics answer two questions. Did we see the problem quickly, and did we stop it with minimal confusion?
A short review table helps:
| Metric | What it reveals | Warning sign |
|---|---|---|
| Detection speed | Alerting quality and pipeline health | Incidents discovered late through manual review |
| Containment speed | SOC readiness and cloud access design | Response blocked by role confusion |
| Drift count | Policy enforcement strength | Repeated exceptions on the same asset types |
| False positives | Detection quality | Analysts closing large volumes without action |
| Coverage completeness | Service maturity | Important logs or environments missing |
Client rollout checklist
Before declaring a deployment ready, walk through a structured validation list.
- Cloud account access is confirmed
Verify that the service can ingest the agreed audit and configuration data from every in-scope environment. - Identity sources are connected
Make sure user and service account events can be correlated with workload and cloud actions. - Critical workloads are tagged
Analysts need ownership, environment, and business context attached to alerts. - Policy baselines exist
Approved images, expected network paths, and privilege boundaries should be documented, not assumed. - Runtime protections are tested
Confirm that suspicious behavior triggers the expected detections or enforcement actions. - Alert routing is mapped
Decide who gets paged, who investigates, and who can contain in each client environment. - Automation is validated
If a workflow disables credentials or opens tickets automatically, test it before go-live. - Exception handling is documented
Every client has edge cases. Write down how temporary exceptions are approved and expired. - Reporting format is agreed
Clients should know what they will receive weekly, monthly, and after an incident. - Rollback and break-glass procedures exist
If a control blocks something critical, responders need a safe, auditable path to restore service.
The checklist does more than reduce mistakes. It also gives MSPs a repeatable standard they can use across clients, which improves margins and lowers onboarding friction.
Conclusion and Next Steps
Cloud native endpoint protection isn’t a renamed endpoint agent. It’s a workload and identity defense model built for short-lived compute, cloud control planes, and hybrid complexity. MSPs that treat it that way can offer a service clients increasingly need and many competitors still explain poorly.
Start with telemetry and policy discipline. Add runtime enforcement where it fits. Correlate identity, workload, and control-plane evidence in one response workflow. That’s the path from basic cloud monitoring to a defensible managed security offering.
If you want to turn external threat visibility into a client-ready managed service, InsecureWeb gives MSPs and security teams white-label tools for dark web monitoring, fake site and account detection, threat intelligence, vulnerability scanning, AI-guided penetration testing, and reputation monitoring, with API access included for easy integration into your existing stack.